


IELTS Academic Writing Task 1 Line Graphs may seem to be easier than other types and you don’t often have problems with them. 👍
Or so you thought! Until you are faced with a graph with too many details that you don’t know which ones to include, which ones to leave out. 🫤
You only get a few minutes to look at the question in the exam — not enough time to figure everything out. That’s why I’m here to help you prep in advance 💡
Even though every graph is different but there are three must-have features that you should always include in your IELTS Academic Writing Task 1 Line Graphs reports, no matter what it is.
By the way, I just dropped an actual IELTS Academic Writing Task 1 — and yes, it’s the real deal. This task could very well show up in your real test. So 📌 take note and don’t skip this one!
Let’s use it as an example!
Task Request
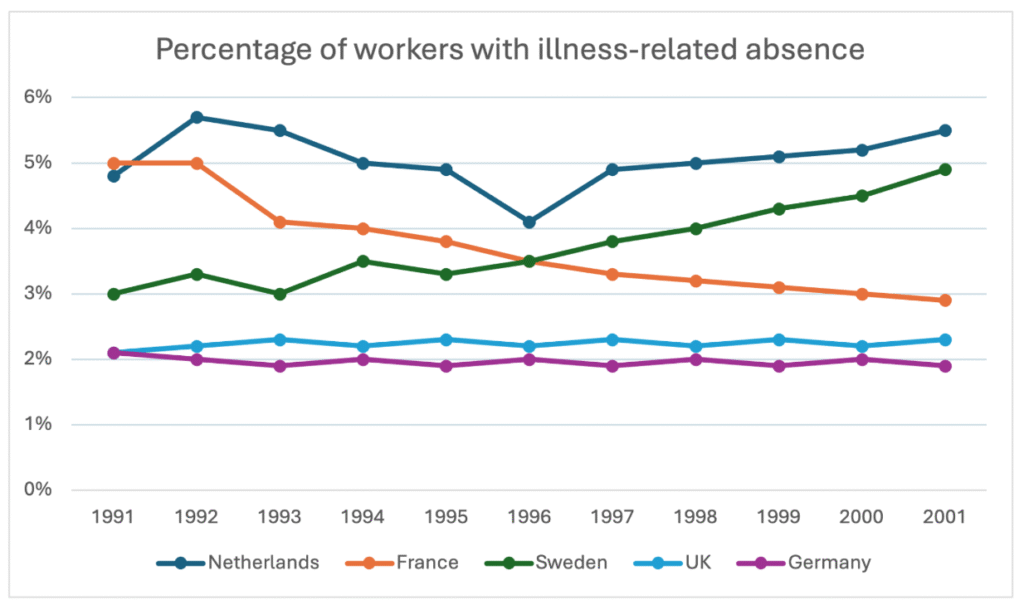
The graph below shows the percentage of workers from five different European countries that were absent for a day or more due to illness from 1991 to 2001.
Summarise the information by selecting and reporting the main features and make comparisons where relevant.
Write at least 150 words.
1️⃣ Always Include the Starting and Ending Points
This is non-negotiable!
📍 Start describing a line where it begins, and finish by pointing out where it ends. These are key reference points that examiners look for.
Think of it as telling a story — you need a clear beginning and ending. So don’t skip this!
For example: In the graph above, the Netherlands lines starts at 4.9% in 1991 and ends at 5.5% in 2001.
2️⃣ Look Out for the “-ests” and “mosts”
Yep, I’m talking about the points where you have to use superlatives (-est and most) to describe, such as
📈 The highest point of a line or among all lines
📉 The lowest point of a line or among all lines
🔺 The most significant changes
These are the standout moments in any graph. Whether it’s a sharp rise or a sudden dip, highlight the extremes — they’re your best friends in Writing Task 1!
For example: In the graph above,
- The UK and Germany lines are always the lowest.
- On the Netherlands line, the 1996 point is the lowest.
Don’t just describe everything — show the examiner that you can pick out the most important features.
3️⃣ Don’t Forget the Intersections 🚦
Think of a real street intersection. It’s where two roads meet — just like in your graph, where lines cross each other.
🛣️ Intersections in a graph show when:
One category overtakes another
Something drops below something else
These are key turning points in the data. In the graph above, there’s one intersection that really stands out 👀
Can you find it?
Drop your answer in the comments — I’d love to see what you think! 💬
Keep then in your pocket 🎒
Remember that you will lose points if you
- describe everything
- miss significant points
Even though each graph may require a different approach, all of them require you. to pick the most significant features to describe to secure your Band 8 IELTS Writing score.
Try this actual IELTS Academic Writing Task 1 Line Graph and get evaluations for 50% off by using code READY50.
Now you have fun learnning!


Responses